Share My View
Layers
Beaches
Regions
Legend
Layers
Beaches
Show All | Hide All |
Expand All | Collapse All |
Regions
App Specific |


Common |


Legend
Beach Location |
NOAA Nautical Charts |
Isolated danger of depth less than the safety contour |
Rock which covers and uncovers or is awash at low water |
Obstruction, depth not stated |
Underwater hazard with depth of 20 meters or less |
Offshore platform |
Lighted beacon tower |
Lighted beacon |
Conical buoy |
Can buoy |
Spherical buoy |
Pillar buoy |
Spar buoy |
Barrel buoy |
Super-buoy |
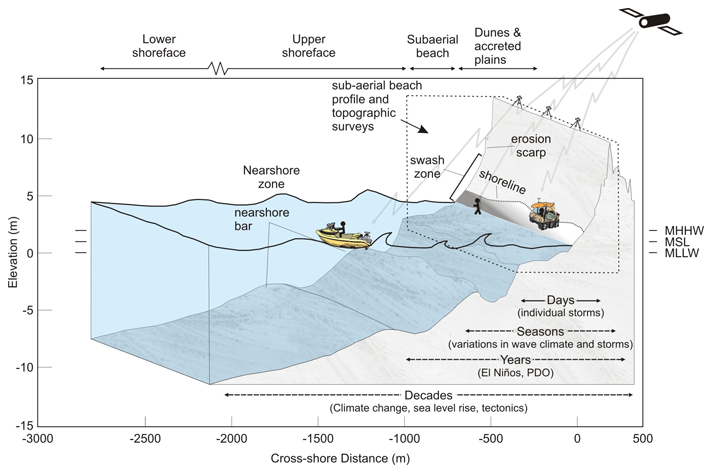
Scientists in the Washington Department of Ecology (WA beaches), Oregon Department of Geology and Mineral Industries (OR beaches), and at Oregon State University (OR/WA nearshore bathymetry) are compiling information on the morphodynamics of beaches along the Pacific Northwest (PNW) coasts of Oregon and Washington in order to document the seasonal, interannual, and long-term changes taking place at multiple beach study sites and at a range of spatial scales (Fig. 1). These data are of broad interest to the public ranging from scientists, coastal resource managers, geotechnical consultants and the public-at-large.

The collection of repeated beach morphology information at appropriate time (e.g. seasonal to annual surveys) and space scales (10s to 100s of feet) in conjunction with periodic detailed topographic information derived from airborne LiDAR and ground surveys, as well as the collection of nearshore bathymetry, are helping coastal scientists and resource managers to resolve a range of issues that have implications for both short-term and long range planning issues, including:
Over the past decade, Scientists in the Washington Department of Ecology, Oregon Department of Geology and Mineral Industries, and Oregon State University Department of Geosciences, have developed a nested sampling scheme for measuring Pacific Northwest changes in the morphology of beaches and shorelines. These include cross-sectional beach surveys, topographic mapping, and bathymetric surveys.
Beach Profiles
Repeated surveys of beach profile (cross-section) sites provide important information on the 2-dimensional response of the beach over a variety of time and space scales. Beach profile surveys on the Oregon and Washington coast are carried out using Real Time Kinematic Differential Global Positioning System (RTK-DGPS) satellite-based technology to accurately map changes taking place along the coast. The RTK-DGPS system consists of a base station that is typically setup on a known point (e.g. a surveyors benchmark) and a base radio. The radio transmits corrected GPS information from the base station to a rover GPS, which may be mounted either on a backpack (surveying cross-sections), ATV (topographical surveying), or personal watercraft (bathymetric surveying). Surveys are carried out during periods of low tide and typically occur approximately every 3 months (e.g. dune-backed beaches) or annually (e.g. bluff-backed shores) and/or after major storm events. The approach used is to walk from the landward edge of the primary dune, over the dune crest (or down the bluff face if feasible), and down the beach face to wading depth. This method can reliably detect elevation changes greater than 4-5 cm well below normal seasonal changes in beach elevation, which typically varies by 1 - 2 m (3 - 6ft).

|

|
Topographic and Shoreline Mapping
In order to understand much larger-scale changes in the shape and configuration of the beach, which may include effects such as the development of rip embayments, hotspot erosion areas due to El Niños, or from major storms, or the movement of sand waves along the beach, mapping of much larger stretches of shore is required. To achieve this, the rover GPS is mounted on top of an ATV vehicle and the vehicle operator may navigate along pre-determined survey transect lines or may drive specific contours of interest such as a tidal datum-based shoreline or an erosion scarp. The region that is typically covered using this approach includes the low tide line up to the toe of the dunes or bluffs. The driver is able to navigate along the beach at speeds of 10 - 15 km/h using a Survey Controller TSCe Computer mounted inside the vehicle, which displays the survey results. Since the GPS unit samples at a rate of 1 sec, the surface mapping can generate a dataset consisting of some 10 - 15,000 survey points within each study area.

|

|
Bathymetric Mapping
It has historically been very difficult and expensive to collect data in the highly dynamic sub-aqueous region and only a few coastlines in the world have sufficient nearshore data to quantify this variability. A new system, based on the Coastal Profiling System developed by Oregon State University, is now being used along the coasts of Oregon and Washington. This system was designed to collect bathymetric data in energetic, nearshore environments. It consists of a highly maneuverable personal watercraft (a wave runner) that is equipped with an echo sounder, GPS receiver and antenna, and an onboard computer. Cross-shore profiles spaced from as little as a few hundred meters to 1 kilometer apart are being collected at multiple sites in both Oregon and Washington revealing important information about the variability in nearshore beach slope, sandbar size and sandbar location. Each profile extends from the shoreline to a deep-water limit ranging between 10 and 20 m (NAVD88). Many of the bathymetric profiles are combined with topographic or beach profile surveys, extending the profiles landward through the dune fields. The nearshore morphology exhibits between 0 and 4 bars, ranging in height from approximately 0.2 m to a remarkable 6.0 m as measured from the seaward crest to landward trough. The bar crest position varies from approximately 100 m from the shoreline for inner swash bars to 1000 m from the shoreline for outer bars. When outer bars are present, the water depth at the outer bar crest ranges from 5.0 to 8.5 m (NAVD88). Crest depths are 3.0 to 5.0 m for the middle bar and 0.0 to 1.5 m for the inner bars.

|

|
Settings
Units
Determines the format in which units are displayed.
Common | °F, ft, ft/s, Hg, etc. |
Scientific | °C, m, m/s, mbar, etc. |
Lat / Lon Format
Determines the format in which latitude and longitude are displayed.
DDD.dddd° | 44.5226 |
DDD° MM' SS.ss" | 44° 31' 21.36" |
DDD° MM.mmm' | 44° 31.356' |
Plot Y-Axis
Determines if plots use a common y-axis for all plots of the same measurement, or if each plot uses a y-axis based on its values.
Global | |
Local |
No Asset Data for Selected Time
Determines what to do when newly selected asset does not have data at the selected time.
Always Ask | |
Select Closest Data Point | |
Do Nothing |
Overlay Value Locations
Determines the location of numeric labels on map overlays. Only applicable to overlays that have value layers.
Geographical Features | |
Grid Points |
Click to Create Places
Determines if map can be clicked once or multiple time to create places.
Once | |
Multiple |


