NVS Maritime Operations
Loading |

Share My View
Layers
Platforms
Routes
Legend
Layers
Models |
Remote Sensing |
Platforms
Show Platforms On Map | ON OFF |
Expand All | Collapse All |
Stationary Platforms
Routes
Click the 'New Route' button to start a new route.
If you sign in, route information will automatically be saved to your account.
Legend
Buoy |
HF Radar |
Land Station |
Shore Station |
Node Location |
Data Age Icons |
No Data |
0 - 1 Hour |
1 - 2 Hours |
2 - 3 Hours |
3 - 4 Hours |
4 - 5 Hours |
5 - 6 Hours |
6 - 7 Hours |
7 - 8 Hours |
8 - 9 Hours |
9 - 10 Hours |
10 - 11 Hours |
11 - 12 Hours |
12 - 24 Hours |
1 - 7 Days |
7 - 30 Days |
More than 30 Days |
NOAA Nautical Charts |
Isolated danger of depth less than the safety contour |
Rock which covers and uncovers or is awash at low water |
Obstruction, depth not stated |
Underwater hazard with depth of 20 meters or less |
Offshore platform |
Lighted beacon tower |
Lighted beacon |
Conical buoy |
Can buoy |
Spherical buoy |
Pillar buoy |
Spar buoy |
Barrel buoy |
Super-buoy |
Understanding how ocean conditions vary in place and time - the ocean "climate" (i.e. the heights, frequency and direction of wave approach; variations in the strength and direction of ocean currents; and, variations in the heights of the tide) offshore any coastline is critically important to the operation and safety of ships working out on the ocean, whether they are fishing boats operating close in to the coast or large container ships travelling across the expanse of the ocean. Besides the maritime industry, information on ocean conditions is important to many other marine stakeholders including coastal residents (be it for recreation or in preparation for a major storm), engineers (e.g. for wave energy extraction or jetty rehabilitation) and by coastal scientists for understanding hazards (e.g. risk from wave runup and overtopping and/or erosion adjacent to property).
The objective of the Maritime Operations web app is to provide easy access to a suite of existing datasets (observations and model overlays and tools) that are pertinent to the maritime/fishing community. This initial release includes model results derived from a combined NOAA/OSU WaveWatch III wave model that includes high resolution nearshore bathymetry (i.e. inclusion of banks, canyons, etc) and shallow water physics enabling improved forecasting capabilities of surface wave conditions across the continental shelf and in the nearshore, offshore the Oregon and southwest Washington coast. To assist with the model overlay, we have developed a series of "virtual" wave stations located near the 75ft bathy contour and spaced ~0.6 miles apart. Users can access a variety of information at each of these nodes, including the forecast significant wave height (out to 84 hours into the future), wave direction, peak period. In time, we intend to add a "situational awareness" capability to the web app, enabling the user to view recent observations for a common variable, across multiple observation sensors, along with information from specific NDBC buoys and tide gauge stations.

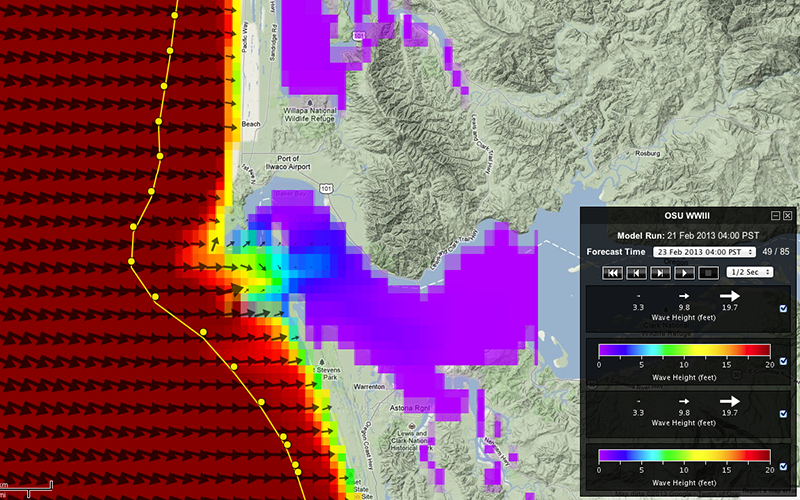
Figure 1: Forecast wave conditions for 0400 hours on February 23, 2013 showing the effects of a major storm event offshore the mouth of the Columbia River. Yellow dots represent the locations of the virtual wave station locations.

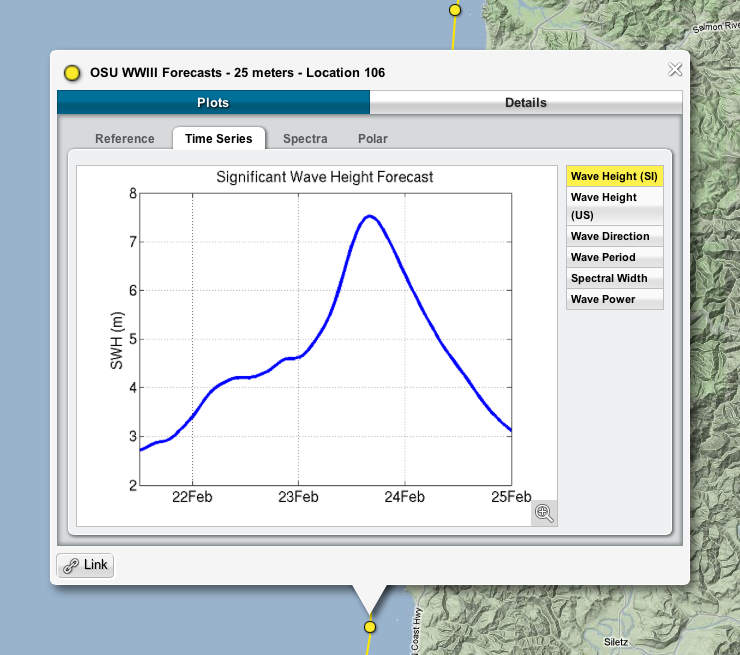
Figure 2: Plot showing the forecast time series of waves offshore the Oregon coast for the period 22-25 February, 2013. Wave conditions over this 3-day period are forecast to increase to ~26 ft at this particular node location. Selecting the various parameters on the right of the plot will allow the user to view other pertinent time series information.
Settings
Units
Determines the format in which units are displayed.
Common | °F, ft, ft/s, Hg, etc. |
Scientific | °C, m, m/s, mbar, etc. |
Lat / Lon Format
Determines the format in which latitude and longitude are displayed.
DDD.dddd° | 44.5226 |
DDD° MM' SS.ss" | 44° 31' 21.36" |
DDD° MM.mmm' | 44° 31.356' |
Plot Y-Axis
Determines if plots use a common y-axis for all plots of the same measurement, or if each plot uses a y-axis based on its values.
Global | |
Local |
No Asset Data for Selected Time
Determines what to do when newly selected asset does not have data at the selected time.
Always Ask | |
Select Closest Data Point | |
Do Nothing |
Overlay Value Locations
Determines the location of numeric labels on map overlays. Only applicable to overlays that have value layers.
Geographical Features | |
Grid Points |
Click to Create Places
Determines if map can be clicked once or multiple time to create places.
Once | |
Multiple |


