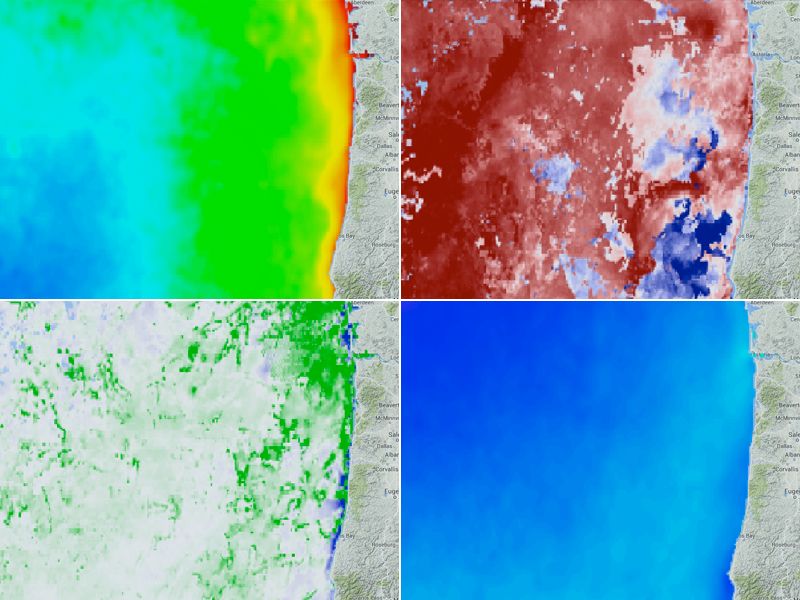
Ocean / atmosphere climatology products can be used to describe important information about the conditions of our region measured on any particular day, against conditions measured in the past, and with respect to their seasonal variability, effects of climate phenomena due to the El Niño Southern Oscillation and their extremes. To improve our understanding of ocean/atmosphere conditions offshore the Pacific Northwest coast, NANOOS has developed a suite of ocean/atmosphere climatology products. These products currently include:
- Climatologies derived for in situ NDBC buoys and parameters (wind speed, air and water temperature and significant wave height); and,
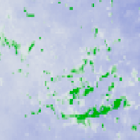
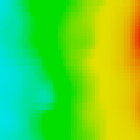
- Ocean overlays depicting monthly averages of chlorophyll abundance and sea surface temperatures derived from MODIS satellite data, as well as NCEP North American Regional Reanalysis (NARR) 10-meter winds and mean sea level anomalies derived from AVISO satellite altimetry data. The latter show deviations in observed mean sea levels relative to the long-term mean.
In Situ Assets
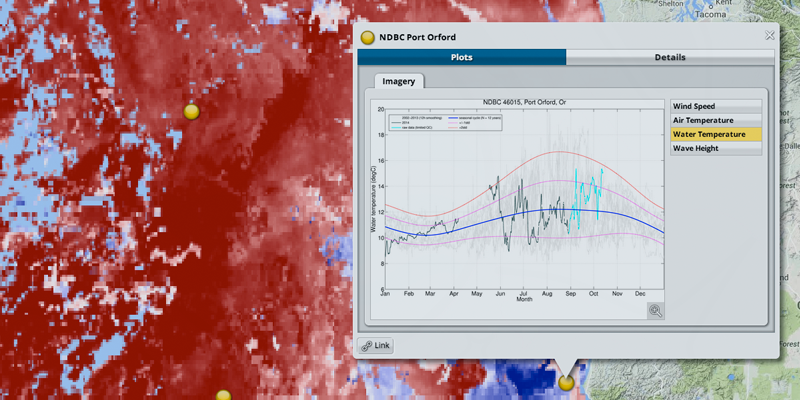
Plots from NDBC buoy data show a variety of useful information, including:
- Previous hourly measurements spanning the entire instruments record is shown in gray;
- Measurements undertaken over the current year are depicted by a solid black line for those data that have been QC'd by NDBC, and raw data (subject to limited QC) as a solid cyan line. These lines are updated on a daily basis to reflect new measurements and QC'd data.
- Plots of significant wave height reflect the actual hourly measurements, while the other parameters have been smoothed using a 12 hour filter to reduce the amount of noise;
- Mean daily values determined from the complete time series are shown as a solid blue line. +/- 1 standard deviation (σ) is plotted in magenta, highlighting the region dominated by 68.3% of the data, while the +2σ red line shows the region dominated by 95.5% of the data. Thus, data that fall outside the +2σ red line highlight conditions that are generally more unusual.
Ocean Overlays
 |
|
This suite of Chlorophyll-a and Sea surface temperature climatology and anomaly data products are derived from daily, 0.0125 degree by 0.0125 degree, MODIS Aqua fields that cover the California Current System for the 12-year period July 2002 through June 2014.
|
In Situ Assets
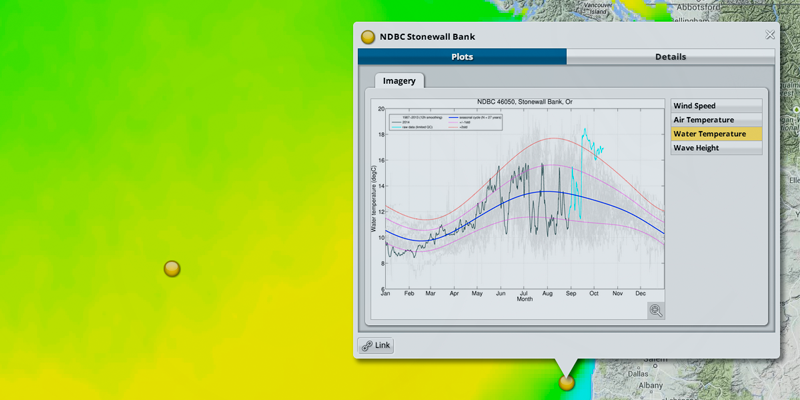
Data measured from selected in situ assets were obtained from the National Data Buoy Center of NOAA and post-processed to ensure any temporal gaps are filled with missing values; we used Not-a-Number (NAN) to designate missing values. The end result is a complete synchronous record for each year of data, which may be used to extrapolate meaningful information about the conditions offshore the NANOOS region. Simple statistics (daily means and standard deviation (σ)) were subsequently derived for several parameters (wind speed, air and water temperature and significant wave height) at each of the stations and plotted. The plots show a variety of useful information, including:
- Previous measurements (hourly) spanning the entire instruments record is shown in gray;
- Measurements undertaken over the current year is depicted by a solid black line for those data that have been QC'd by NDBC, and raw data (subject to limited QC) as a solid cyan line. Both sets of data are updated on a daily basis and the time series extended to reflect the addition of new measurements, as well as new data that has been QC'd.
- Plots of the significant wave height reflect the actual hourly measurements, while the other parameters have been smoothed using a 12 hour filter to reduce the amount of noise;
- The mean daily value determined from the complete time series is shown as a solid blue line. Plus or minus 1σ is plotted in magenta, highlighting the region dominated by 68.3% of the data, while a +2σ red line is included to show the region dominated by 95.5% of the data. Thus, data that fall outside the +2σ red line highlight conditions that are generally more unusual.
MODIS Aqua Satellite Overlays
 |
|
This suite of Chlorophyll-a and Sea surface temperature (SST) climatology and anomaly data products are derived from daily, 0.0125 degree by 0.0125 degree, MODIS Aqua CHLA and SST fields that cover the California Current System (22N - 51N, 135W - 105W) for the 12-year period July 2002 through June 2014. These daily fields, obtained from the NOAA CoastWatch West Coast Regional Node website, were processed using a successive 3x3, 5x5 and 7x7 grid cell hybrid median filtering technique.
|
 |
|
This technique was found to effectively reduce noise in the daily fields while maintaining features and detail in important regions such as capes and headlands. The resulting median filtered daily fields were then linearly interpolated to a 0.025 by 0.025 degree grid and averaged to create 144 monthly mean fields. The seasonal cycles at each 0.025 degree by 0.025 degree grid cell were obtained by fitting each multiyear time series of monthly means to a nine-parameter regression model consisting of a constant plus four harmonics (frequencies of N/(1-year), N-1,4; Risien and Chelton 2008, JPO). Even with the median filtering and the temporal averaging of the daily fields, the highly inhomogeneous nature of the MODIS fields still resulted in regression coefficients that were excessively noisy.
|
 |
|
We therefore applied the same successive 3x3, 5x5 and 7x7 hybrid median filtering technique, described above, to the regression coefficients before finally spatially smoothing the coefficients using a loess smoother (Schlax et al. 2001, JTECH) with filter cutoff wavelengths of 0.25 degree latitude by 0.25 degree longitude. The seasonal cycles were then calculated from the filtered regression coefficients for each 0.025 degree by 0.025 degree grid cell using the mean and all four harmonics. A more detailed description of these data products can be found at here. It is important to note that THIS SUITE OF DATA PRODUCTS IS HIGHLY EXPERIMENTAL and is strictly intended for scientific evaluation by experienced marine scientists.
|


